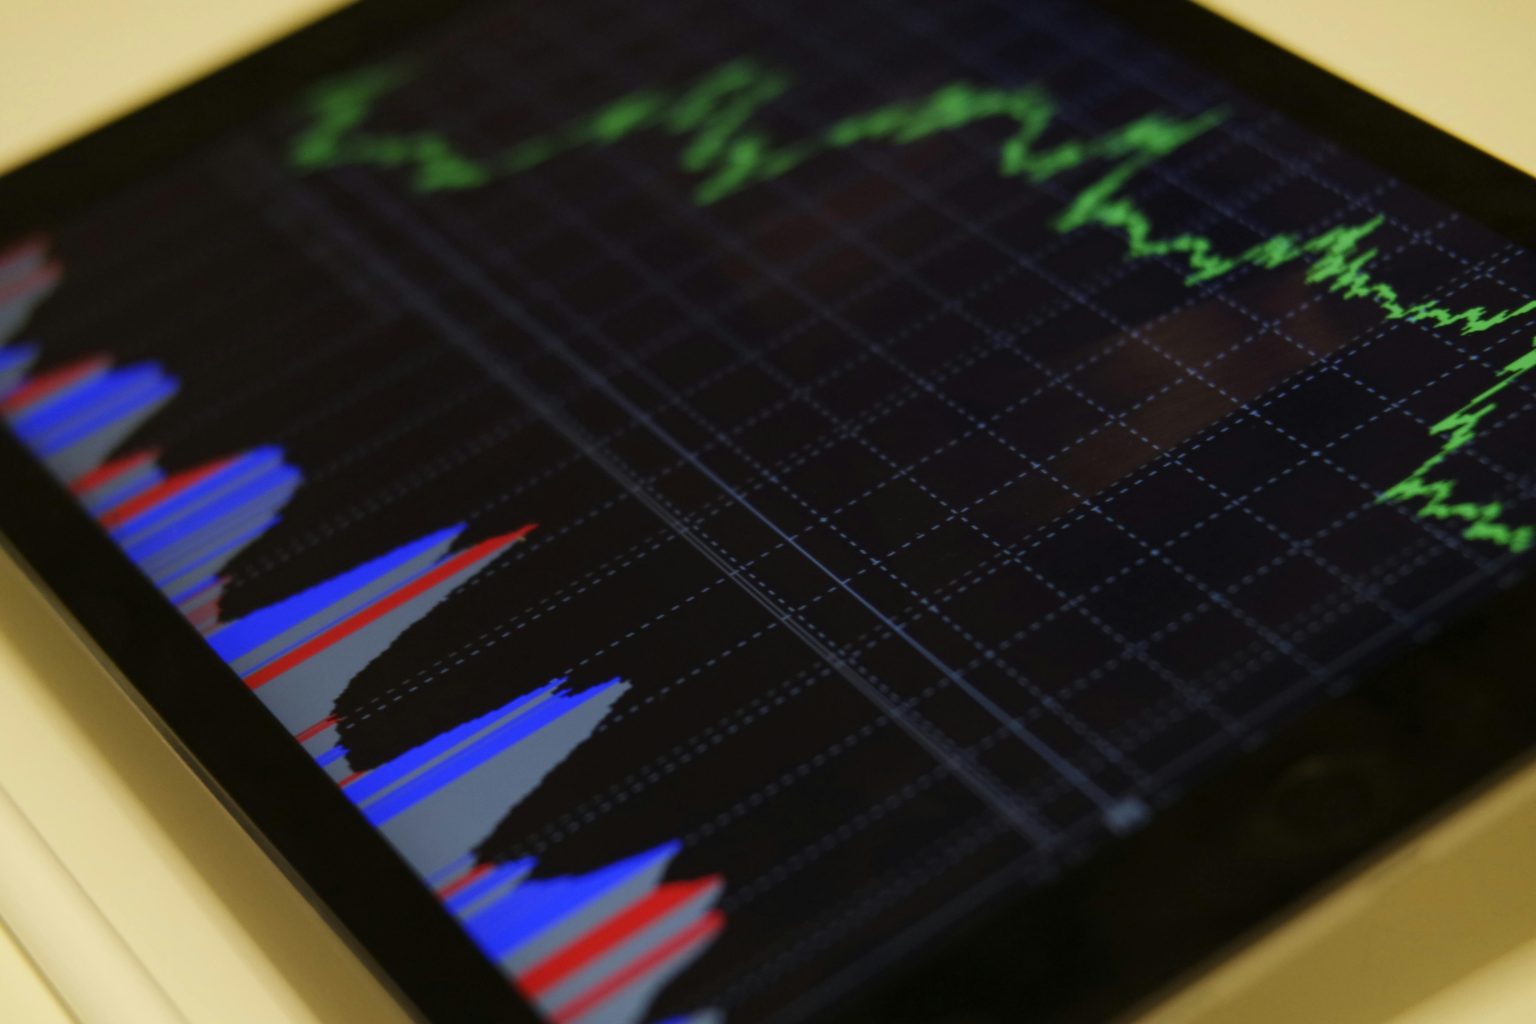
In 2025, the global economy is a mosaic of conflicting signals—growth in some sectors, contraction in others; stable employment in one region, instability elsewhere; inflation cooling slightly in the West, but resurging in parts of Asia. In this fragmented landscape, many traders and investors are turning away from traditional narratives and choosing instead to read what the charts themselves have to say.
A World Economy Gripped by Contradictions
The post-pandemic recovery gave way to a more uncertain phase. Supply chains have adapted, yet remain vulnerable. Interest rates, which rose rapidly between 2022 and 2024, have now plateaued in many advanced economies, but without a uniform direction among central banks. The U.S. Federal Reserve has adopted a cautiously dovish stance, while the European Central Bank faces mounting pressure from both inflation-wary states and recession-prone members. Meanwhile, emerging markets are experiencing unpredictable capital flows as investors search for yield amid global instability.
Energy prices remain volatile due to regional conflicts and transitional policies, while consumer sentiment shows resilience in some areas but fatigue in others. All these forces make it increasingly difficult to rely solely on news headlines or economic forecasts. Every analyst seems to tell a different story, and often, none of them match the market’s next move.
The Limitation of Fundamental Narratives
Traditionally, investors followed macroeconomic indicators—GDP growth, unemployment figures, inflation rates—to guide their decisions. But in today’s environment, those indicators often lag behind market reality. By the time official data is published, markets may have already priced in the expected outcome or reacted to an entirely different signal.
Moreover, global markets are now more reactive to sentiment, social media, and unforeseen events. Geopolitical tensions, sudden policy reversals, or even a viral tweet can move billions in capital within minutes. In this reality, where noise is constant and clarity rare, many traders are shifting their focus toward what is immediate, visual, and measurable: the price chart.
Reading the Market’s Own Language
Trade from chart—also known as technical analysis—is the practice of making decisions based on price patterns, support and resistance zones, volume, and trend behavior. Rather than trying to predict what the market should do, chart-focused traders ask a different question: what is the market doing right now?
A price chart is not an opinion—it’s a record of real transactions, a reflection of where money has flowed, paused, reversed, or broken out. It captures the collective psychology of thousands or millions of participants. When interpreted correctly, it offers immediate insight into supply and demand, fear and greed, and momentum versus exhaustion.
This makes chart analysis not only useful for short-term trades but increasingly relevant for positioning in a world where fundamentals are slow and often contradictory. While economists debate over interest rate paths or fiscal policy projections, the chart may already be showing a reversal, a breakout, or a long-awaited correction.
Clarity Through Structure
Charts offer more than raw data—they offer structure. In chaotic moments when the news cycle is filled with conflicting headlines, the chart remains a consistent reference point. It doesn’t change its story; it merely updates with every tick, giving traders a disciplined framework to act within.
Moving averages reveal the broader direction of momentum. Candlestick patterns show moments of reversal or continuation. Volume spikes tell us where interest is concentrated. And most importantly, these tools don’t require prediction—they allow for reaction based on observable evidence.
By trading from the chart, traders are not ignoring the world—they are translating it into a more readable format. It’s the market’s own language, unfiltered by opinion and stripped of narrative bias.
In a Confusing World, Let the Price Show You the Way
In this era of economic fragmentation and rapid-fire news cycles, relying on charts is not about abandoning fundamentals—it’s about grounding yourself in real-time evidence. Charts don’t lie; they simply reflect the collective action of the market at every moment.
For traders seeking to cut through the fog, chart analysis is more than a technique—it’s a survival tool. It allows you to see what others miss, to enter with confidence and exit with discipline. In a world full of noise, the chart speaks clearly—if you learn to listen.
Inizio modulo
Fine modulo


